Hopp til hovedinnhold
Omslagsbilde

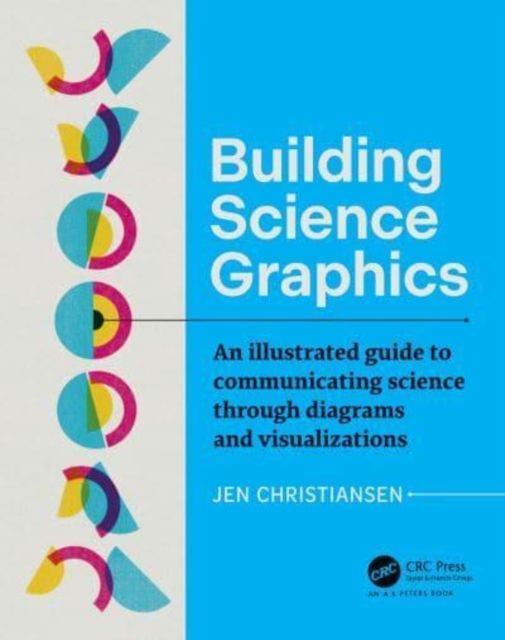
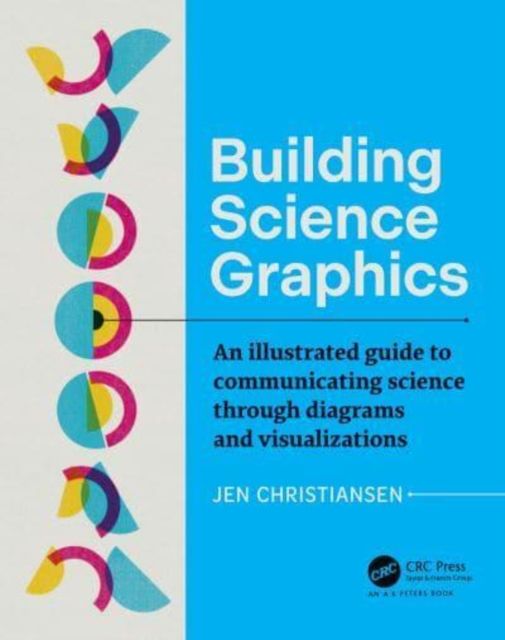
Building Science Graphics : An Illustrated Guide to Communicating Science through Diagrams and Visualizations

Christiansen, Jen

I salg

Leveringstid: 3-10 dager

Handlinger

Beskrivelse

Omtale

Building Science Graphics: An illustrated guide to communicating science through diagrams and visualizations is a practical guide for anyone—regardless of previous design experience and preferred drawing tools—interested in creating science-centric illustrated explanatory diagrams. Starting with a clear introduction to the concept of information graphics and their role in contemporary science communication, it then outlines a process for creating graphics using evidence-based design strategies. The heart of the book is composed of two step-by-step graphical worksheets, designed to help jump-start any new project. The author website, featuring further resources and links, can be found here: https://www.buildingsciencegraphics.com/. This is both a textbook and a practical reference for anyone that needs to convey scientific information in an illustrated form for articles, poster presentations, slide shows, press releases, blog posts, social media posts and beyond.

  • Utgivelsesdato:

    31.08.2022

  • ISBN/Varenr:

    9781032106748

  • Språk:

    Engelsk

  • Forlag:

    Taylor & Francis Ltd

  • Innbinding:

    Heftet

  • Fagtema:

    Kunst

  • Serie:

    AK Peters Visualization Series

  • Litteraturtype:

    Faglitteratur

  • Sider:

    333

  • Høyde:

    19 cm

  • Bredde:

    24.2 cm

Let’s Get Infografit : A Graphic Look at Exercise and Health

Let’s Get Infografit : A Graphic Look at Exercise and Health

Holmes, Nigel
9781032777276 Heftet
03.10.2025
Engelsk

Forventes utgitt
Exploratory Data Analysis : Descriptive Analysis, Visualization, and Dashboard Design (with Codes in Python)

Exploratory Data Analysis : Descriptive Analysis, Visualization, and Dashboard Design (with Codes in Python)

Nunes de Castro, Leandro
9781032939827 Heftet
23.09.2025
Engelsk

Forventes utgitt
The Golden Age of Data Visualization : How Did We Get Here?

The Golden Age of Data Visualization : How Did We Get Here?

Marriott, Kim
9781032830773 Heftet
04.09.2024
Engelsk

Produseres på bestilling
Data Visualization for People of All Ages

Data Visualization for People of All Ages

Organ, Nancy
9781032301006 Heftet
24.04.2024
Engelsk

I salg
Data Visualization in Excel : A Guide for Beginners, Intermediates, and Wonks

Data Visualization in Excel : A Guide for Beginners, Intermediates, and Wonks

Schwabish, Jonathan
9781032343266 Heftet
31.05.2023
Engelsk

I salg
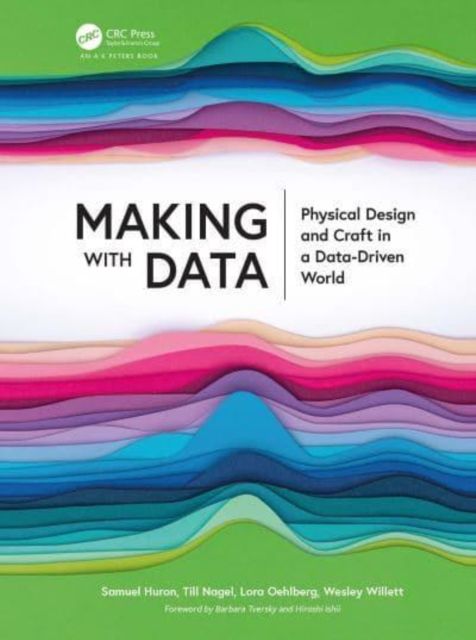
Making with Data : Physical Design and Craft in a Data-Driven World

Making with Data : Physical Design and Craft in a Data-Driven World

9781032182223 Heftet
20.12.2022
Engelsk

I salg
Questions in Dataviz : A Design-Driven Process for Data Visualisation

Questions in Dataviz : A Design-Driven Process for Data Visualisation

Richards, Neil
9781032139449 Heftet
02.11.2022
Engelsk

I salg
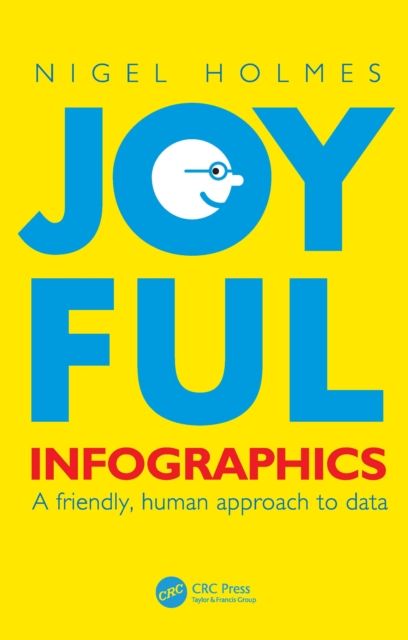
Joyful Infographics : A Friendly, Human Approach to Data

Joyful Infographics : A Friendly, Human Approach to Data

Holmes, Nigel
9781032115580 Heftet
30.07.2022
Engelsk

I salg
Information Theory Tools for Visualization

Information Theory Tools for Visualization

Bardera, Anton • Feixas, Miquel • Chen, Min • Sbert, Mateu • Viola, Ivan • Shen, Han-Wei
9781032339924 Heftet
12.07.2022
Engelsk

Produseres på bestilling
Building Science Graphics : An Illustrated Guide to Communicating Science through Diagrams and Visualizations

Building Science Graphics : An Illustrated Guide to Communicating Science through Diagrams and Visualizations

Christiansen, Jen
9781032109404 Innbundet
20.12.2022
Engelsk

Produseres på bestilling