I salg
Leveringstid: 14-30 virkedager
Handlinger
Beskrivelse
Omtale
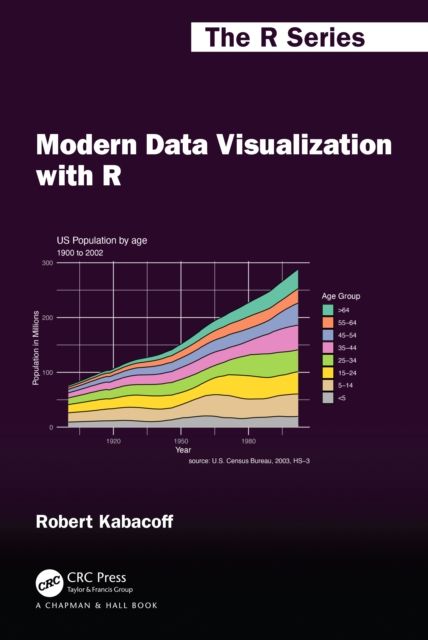
Ways that raw and summary data can be turned into visualizations that convey meaningful insights: basic graphs, bar charts, scatter plots, and line charts, and progresses to tree maps, alluvial plots, radar charts, mosaic plots, grouped dot plots, effects plots, multivariate presentations such as corrgrams, biplots, network diagrams.
Detaljer
-
Utgivelsesdato:
29.03.2024
-
ISBN:
9781032289496
-
Språk:
, Engelsk
-
Forlag:
Chapman & Hall/CRC -
Fagtema:
-
Litteraturtype:
-
Sider:
259
-
Høyde:
23.4 cm
-
Bredde:
15.6 cm